Safety nets are great to have, particularly in business as fast-moving as retail. In your business, this safety net goes by a slightly different name- safety stock.
What Is Safety Stock?
In an ideal scenario, your suppliers would always deliver stock to you on time and you would never have to deal with sales fluctuations. Essentially, you would never really run out of stock and thus, would unfailingly be able to cater to consumer demands.
However, in reality, things are different. You have supply problems often, your sales patterns change based on product demand, or you run out of inventory because of forecasting flaws.
Safety stock is essentially the additional stock of a product you need to hold to lower your risk of a stockout. Having enough of it can go a long way in catering to consumer demand in the event of unforeseen circumstances.
Why Do I Need Safety Stock?
Safety stock is a buffer- a cushion against varying lead times. Sometimes, vendors may take longer than usual to fulfill your order. In such cases, your safety stock comes to the rescue and helps you see the product, and avoid an out-of-stock situation. Having safety stock helps you not lose opportunities that come in time of a supply or sales pattern fluctuation.
How To Calculate Safety Stock
There are several different ways of calculating safety stock. Every calculation is specific to the situation in which you’ll be applying it.
Formula 1: The Average Safety Stock Value
The simplest formula for calculating safety stock involves using the maximum and average lead times to get a rough estimate. This formula is also ideal for products that have lower demand overall and also have very few seasonal fluctuations. In any case, you can use this formula to run a quick check or to see if the other formulae you used have provided accurate results.
Here’s the formula you can use
Safety Stock = (Maximum Daily Sales X Maximum Lead Time) – (Average Daily Sales X Average Lead Time)
Formula 2: Heizer And Render’s Formula
Safety Stock= ?????
Where Z is the desired service factor or the degree at which you want to fulfill the orders placed with you. This is explained below in the section titled ‘Getting The Value Of Service Factor (Z) For Safety Stock Calculation (Formula 2 and Formula 3)’, since it is common to both this formula and the next one.
???? is the standard deviation in lead time or the degree and frequency by which average lead time differs from the actual lead time.
This formula is ideal when your suppliers often have significant variations in their supply schedule. So, you can use this formula to see what safety stock you need to maintain to continue to serve your customers as you do now.
Because of the use of standard deviation, this formula provides a more accurate measure. However, it does not take seasonal fluctuations in demand into account, unlike the next formula.
Reference: Heizer, Jay H., and Barry Render. Operations management. Vol. 1. Pearson Education India, 2008.
Formula 3: Greasley’s Formula
This formula takes both lead times and demand fluctuations into account.
Safety Stock = σLT × D avg x Z
where
- σLT is the standard deviation of lead time
- D avg is the average demand, and
- Z is the desired service factor, which is the probability that the amount of inventory you have during the lead time is enough to meet the expected demand / the probability that a stockout will not occur
Finding Standard Deviation For Lead Time (σLT) In Safety Stock Formula
Lead time is essentially the total time it takes to replenish your stock – right from when you place a purchase order till the stock reaches your warehouse. Because this time is almost never consistent, finding the standard deviation of lead time can help you arrive at a value that reflects the actual situation better.
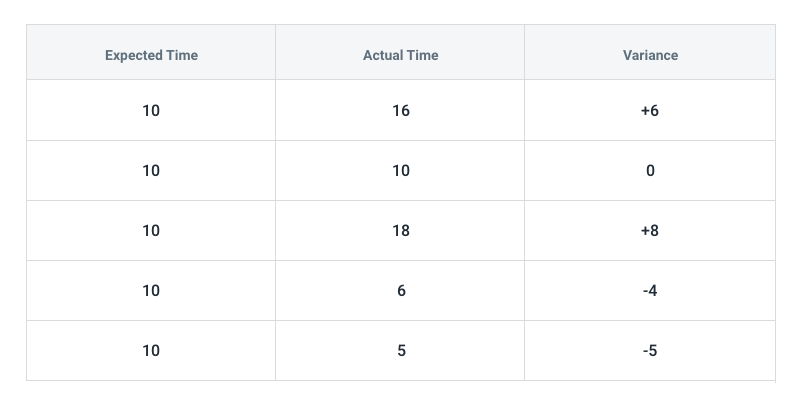
Let us discuss an example to understand this better. Say you are a retailer of men’s jackets and you expect your supplier to send a new shipment of the jackets to you in about 10 days, which is your expected time. If your supplier takes more or less time to ship stock to you each time – which is the actual time – there is a difference between the expected and actual time, which is known as the variance.
Considering all this and assigning random values for actual time for your last 5 orders, we can tabulate everything as below:

With the above values, you can start calculating the standard deviation. Positive variance indicates that your supplier took more time than expected to ship stock to you. Negative numbers indicate that your stock arrived earlier than expected.
Step 1: First, add the variances.
6+0+8+(-4)+(-5) = 14 – 9 = 5
Step 2: Then, divide the sum of the variances by the sample portion, which here is 5 (since we are taking 5 shipments into consideration).
5/5 = 1
Step 3: Finally, add this number (1) to the average expected time (8) to arrive at the standard deviation.
8+1 = 9
So, the standard deviation for lead time represents the average amount of time it will take to restock the jackets after accounting for the variability in actual time for your past orders. This is also the amount of time that your safety stock will have to sustain you until your new stock arrives.
Arriving At Average Demand (D avg) To Find Safety Stock
To calculate average demand, identify the time frame you want to take into consideration first – the duration between reorders is an ideal time frame.
Considering the same example from above, say you reorder the jackets once a month. Then, your time frame will account for a month’s worth of sales, which you can account for in weekly increments.

Now, calculating the average demand is quite simple.
All you need to do is find the sum of the sales volumes of all 4 weeks and divide it by the number of days in your time frame of one month.
Average Demand = (100+200+300+400)/30
= 1000/ 30
= 33 jackets a day
Getting The Value Of Service Factor (Z) For Safety Stock Calculation (Formula 2 and Formula 3)
Arriving at the right service level for a product means balancing inventory costs and the cost of a stockout. In simpler terms, if your desired service level is higher, you will need to hold more safety stock. Then again, the cost functions of this vary based on the type of business – while inventory costs can often be figured out easily, stockout costs are quite complex.
However, for retail businesses, the typical service level is about 90% with higher priority items hitting 95%. Remember that increasing a product’s service level would mean the need for more safety stock and hence higher costs associated with it. So, your service level has to be realistic and meet the needs of your business model. You can choose an optimum service level with a normal distribution chart like the one below and find the corresponding service factor (Z) accordingly.

Safety Stock Calculation With This Formula
So, if you want to maintain a service level of 90%, your service factor (Z) will be 1.28.
Now that we have the values for the standard deviation for lead time (σLT), average demand (D avg), and the service factor (Z), we can calculate the safety stock for the same example from earlier as:
Safety Stock = σLT × D avg x Z
= 9 days x 33 jackets x 1.28
= 380 jackets
So, you will need 380 jackets of safety stock to satisfy demand while waiting for the new stock during the lead time of 9 days with a service factor of 90%.
Reference: Greasley, Andrew. Operations management. Sage, 2007.
Don’t Avoid These Calculations! Calculating safety stock accurately is crucial to avoid losing significant amounts of revenue due to stockouts from a hard-to-predict supply chain. So, ensure that you give it the importance it deserves in your inventory management best practices. Also, using a good inventory management system can help you make the most of these calculations and truly benefit from them.
Request Demo
thank you
thank you
thank you
Request Demo
window.IS_INDIA = 0;window.USER_COUNTRY = 'China';window.USER_CITY = 'Hangzhou';window.USER_COUNTRY_ISO = 'CN';

Armed with a degree and a pen, loves to tell stories. When not telling stories, she also works. Hard to decide which one she likes more.
(function(d){var s=d.createElement('script');s.type='text/javascript';s.src='https://a.omappapi.com/app/js/api.min.js';s.async=true;s.dataset.campaign='cxecxy09nlvnnyvfiqjf';s.dataset.user='22867';d.getElementsByTagName('head')[0].appendChild(s);})(document);
,